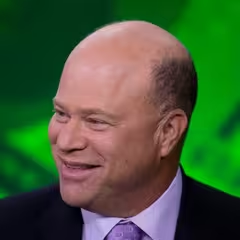
David Tepper Appaloosa
David Tepper, founder of Appaloosa Management, is a billionaire hedge fund manager renowned for his expertise in distressed debt investing and contrarian bets. He is known for high-risk, high-reward strategies that have generated significant returns, such as investing in struggling banks during the 2008 financial crisis. His investment philosophy emphasizes deep value analysis, understanding market psychology, and making high-conviction decisions, often going against prevailing sentiment.
Top Buys
| Rank | Stock | Value |
|---|---|---|
| 1 |

Freeport-McMoran
FCX
|
+$53.6M |
| 2 |

United Airlines
UAL
|
+$25.5M |
| 3 |

HCA Healthcare
HCA
|
+$25.4M |
| 4 |

Celanese
CE
|
+$23.4M |
| 5 |

Ingredion
INGR
|
+$19.4M |
Top Sells
| Rank | Stock | Value |
|---|---|---|
| 1 |

State Street SPDR S&P 500 ETF Trust
SPY
|
+$729M |
| 2 |

Apple
AAPL
|
+$64.5M |
| 3 |

Comcast
CMCSA
|
+$61.4M |
| 4 |

Goodyear
GT
|
+$60.4M |
| 5 |

Bank of America
BAC
|
+$58.9M |
Sector Composition
| Rank | Sector | Weight |
|---|---|---|
| 1 | Miscellaneous | 23.11% |
| 2 | Industrials | 20.52% |
| 3 | Financials | 18.57% |
| 4 | Consumer Discretionary | 17.01% |
| 5 | Materials | 6.44% |
| Name | Market Value | Portfolio Weight | Shares or Principal |
Change in Stake | Capital Flow | Held Since | |
|---|---|---|---|---|---|---|---|
|
1
State Street SPDR S&P 500 ETF Trust
SPY
$800B
| $645M | 10.27% |
3,837,366
-4,349,594
| -53% | -$729M |
2013 Q2
1 quarter
|
|

2
Citigroup
C
$205B
| $472M | 7.52% |
9,733,639
+132,000
| +1% | +$6.67M |
2013 Q2
1 quarter
|
|

3
Invesco QQQ Trust
QQQ
$467B
| $453M | 7.22% |
5,750,000
| – | – |
2013 Q2
1 quarter
|
|
|
4
Goodyear
GT
$1.19B
| $423M | 6.73% |
18,843,154
-3,156,846
| -14% | -$60.4M |
2013 Q2
1 quarter
|
|
|
5
United Airlines
UAL
$35.5B
| $262M | 4.17% |
8,523,821
+792,777
| +10% | +$25.5M |
2013 Q2
1 quarter
|
|

6
Delta Air Lines
DAL
$56.7B
| $198M | 3.15% |
8,400,000
-1,890,884
| -18% | -$39.4M |
2013 Q2
1 quarter
|
|
|
7
HCA Healthcare
HCA
$104B
| $196M | 3.11% |
4,573,082
+650,000
| +17% | +$25.4M |
2013 Q2
1 quarter
|
|

8
MetLife
MET
$64.5B
| $189M | 3.01% |
4,523,700
-92,004
| -2% | -$3.96M |
2013 Q2
1 quarter
|
|

9
General Motors
GM
$72.5B
| $179M | 2.85% |
4,983,202
-87,867
| -2% | -$3.15M |
2013 Q2
1 quarter
|
|
|
LCC
10
DELISTED
US AIRWAYS GROUP INC.
LCC
| $178M | 2.83% |
9,385,636
+46,262
| +0.5% | +$819K |
2013 Q2
1 quarter
|
|

11
Qualcomm
QCOM
$185B
| $170M | 2.7% |
2,517,323
-480,000
| -16% | -$31.5M |
2013 Q2
1 quarter
|
|

12
Huntsman
HUN
$1.67B
| $161M | 2.56% |
7,816,166
+860,000
| +12% | +$15.7M |
2013 Q2
1 quarter
|
|

13
State Street SPDR Dow Jones Industrial Average ETF Trust
DIA
$45.6B
| $151M | 2.4% |
1,000,000
| – | – |
2013 Q2
1 quarter
|
|

14
AIG
AIG
$43B
| $135M | 2.15% |
2,778,848
-55,000
| -2% | -$2.61M |
2013 Q2
1 quarter
|
|

15
MGM Resorts International
MGM
$8.47B
| $134M | 2.14% |
6,576,869
-135,000
| -2% | -$2.35M |
2013 Q2
1 quarter
|
|

16
Prudential Financial
PRU
$42.4B
| $132M | 2.1% |
1,692,581
-34,500
| -2% | -$2.71M |
2013 Q2
1 quarter
|
|

17
Ford
F
$47.6B
| $130M | 2.07% |
7,698,815
-2,760,000
| -26% | -$46.6M |
2013 Q2
1 quarter
|
|

18
Alphabet (Google) Class C
GOOG
$3.6T
| $127M | 2.02% |
5,818,086
-803,440
| -12% | -$17.8M |
2013 Q2
1 quarter
|
|

19
Hartford Insurance Group
HIG
$36.8B
| $126M | 2.01% |
4,052,770
-82,000
| -2% | -$2.56M |
2013 Q2
1 quarter
|
|
|
20
Apple
AAPL
$5.18T
| $116M | 1.85% |
6,835,360
-3,888,752
| -36% | -$64.5M |
2013 Q2
1 quarter
|
|

21
Fluor
FLR
$6.28B
| $104M | 1.65% |
1,459,629
-30,000
| -2% | -$1.94M |
2013 Q2
1 quarter
|
|

22
Transocean
RIG
$6.19B
| $101M | 1.6% |
2,259,167
-301,000
| -12% | -$14.2M |
2013 Q2
1 quarter
|
|
|
CBI
23
DELISTED
Chicago Bridge & Iron Nv
CBI
| $100M | 1.59% |
1,471,044
-30,000
| -2% | -$1.85M |
2013 Q2
1 quarter
|
|

24
Owens Corning
OC
$8.94B
| $93.4M | 1.49% |
2,459,292
-50,000
| -2% | -$1.95M |
2013 Q2
1 quarter
|
|

25
DELISTED
EMC CORPORATION
EMC
| $86.6M | 1.38% |
3,389,569
-319,000
| -9% | -$8.28M |
2013 Q2
1 quarter
|
|
Similar funds








David Tepper's Q3 2013 Portfolio in Review
As of Q3 2013, David Tepper held 79 positions worth $6.28B, down 9.2% from $6.92B the previous quarter. Its ten largest holdings account for 51% of the portfolio.
David Tepper withdrew a net $1.29B in Q3 2013, closing 15 positions and reducing 41 holdings. Its most notable exit was Comcast, an estimated $61.4M position sold in full.
By sector, the portfolio is most concentrated in Miscellaneous at 23% of assets, down from 31% a quarter earlier, followed by Industrials and Financials.
Against the trend, David Tepper opened a new position in Freeport-McMoran worth $58M.
- David Tepper's largest Q3 2013 buy was Freeport-McMoran: 1,754,639 shares worth $58M.
- David Tepper added most to United Airlines in Q3 2013, an estimated $25.5M increase.
- David Tepper's biggest Q3 2013 reduction was State Street SPDR S&P 500 ETF Trust, cutting an estimated $729M.
- David Tepper fully exited Comcast in Q3 2013, selling an estimated $61.4M.
- David Tepper's ten largest holdings make up 51% of its $6.28B portfolio in Q3 2013.
- David Tepper opened 7 new positions and closed 15 in Q3 2013.
- David Tepper's portfolio value fell 9.2% quarter-over-quarter to $6.28B.
Based on Appaloosa's 13F filing for Q3 2013, filed 14 Nov 2013.