Defining Beta
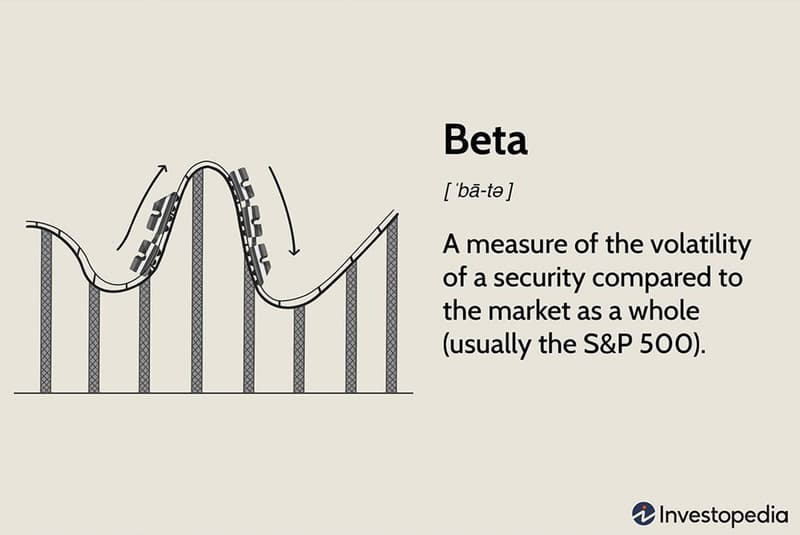
The volatility of a stock in proportion to the market as a whole is measured by its beta. The S&P 500 Index, for example, has a beta of 1.0 by definition, and individual companies are graded according to how much they depart from the market.
A stock with a beta above 1.0 fluctuates more than the market over time. A stock's beta is less than 1.0 if it moves less than the market. Low-beta stocks carry less risk but have lower potential returns while high-beta stocks are considered to carry greater risk but have larger potential returns.
The capital asset pricing model (CAPM), which is used to determine the cost of equity investment, includes beta as one of its components. The rate of return that shareholders can reasonably expect based on perceived investment risk is calculated using the CAPM formula using the total average market return and the stock's beta value. Beta can have an effect on a stock's predicted rate of return and share price in this fashion.
How does Beta work?
In the end, a stock's beta is used by an investor to determine how much risk it adds to its portfolio. While a stock with minimal market variance doesn't significantly raise risk in a portfolio, it also reduces the possibility of higher gains.
A stock should have a strong R-squared value in relation to the benchmark in order to ensure that it is being compared to the appropriate benchmark. R-squared is a statistical metric that depicts the proportion of historical price changes in securities that can be accounted for by changes in the benchmark index. A security with a high R-squared value, with respect to its benchmark, may indicate a more pertinent benchmark when utilizing beta to assess the level of systematic risk.
For instance, the performance of a gold exchange-traded fund (ETF) like the SPDR Gold Shares (GLD) is based on gold bullion. As a result, the S&P 500 and a gold ETF would have a low beta and R-squared relationship.
A stock investor may divide risk into two categories as one method of thinking about it. The risk of the market as a whole declining falls under the heading of systematic risk in the first category. An example of a systematic risk event is the financial crisis of 2008; no amount of diversification could have stopped investors from losing value in their stock portfolios. Un-diversifiable risk is another name for systematic risk.
Unsystematic risk sometimes referred to as diversifiable risk, is the unpredictability connected to a specific stock or sector of the economy. Unsystematic risk is demonstrated, for instance, by the shocking revelation that Lumber Liquidators (LL) sold hardwood flooring in 2015 that contained unsafe amounts of formaldehyde. It was a risk unique to that business. Diversification can help reduce unsystematic risk in some cases.
How does Beta work?
The covariance between a security's return and the market return as well as the variance of market returns must be understood in order to determine a security's beta.
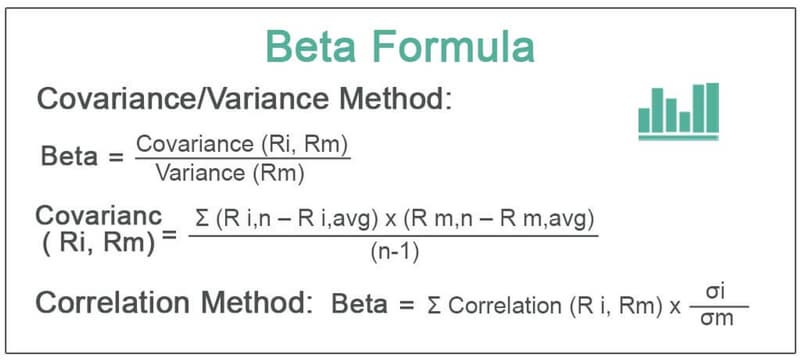
Covariance: Two equities' covariance is a measure of their mutual movement. As there is a positive correlation, the stocks tend to move in tandem when their prices increase or decrease. The equities move in opposition to one another when the covariance is negative.
Variance: Contrarily, variation describes how far a stock deviates from its mean. For instance, variance is used to gauge the price volatility of a particular stock over time. The correlation between the price movements of two different stocks is gauged using covariance.
The covariance of an asset's return with the return of the benchmark, divided by the variance of the benchmark's return over a specific period, is the formula for computing beta.
Beta values
Beta Value Equal to 1.0
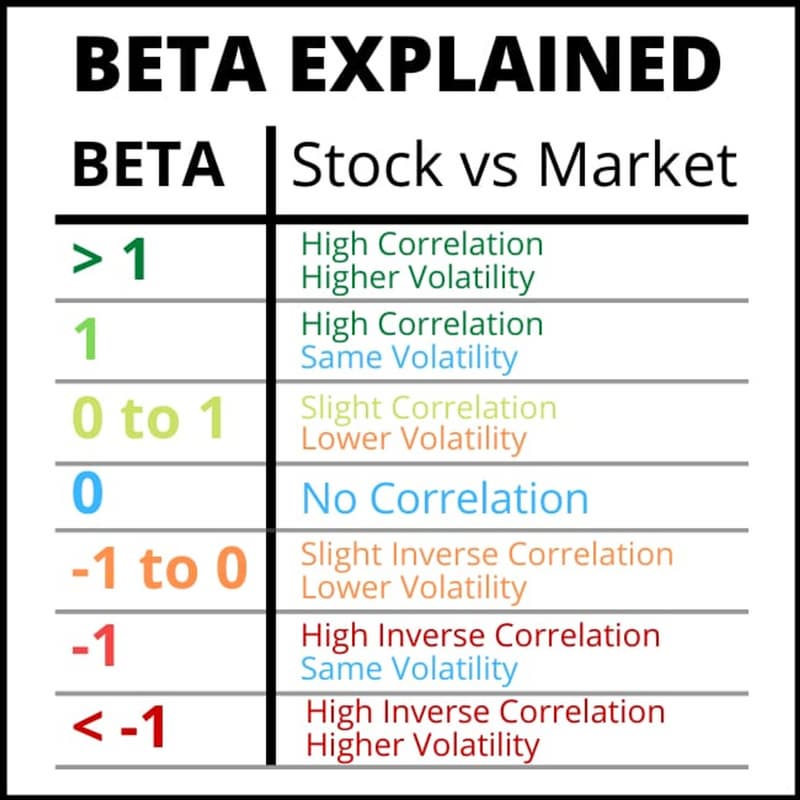
A stock's price movement is highly connected with the market if its beta value is 1.0. Systematic risk exists for stocks with betas of 1. The beta calculation, however, is unable to identify any irrational risk. A stock with a beta of 1.0 can be added to a portfolio without increasing risk or the possibility that the portfolio would generate an excess return.
Beta Value Less Than One
A security is considered to be theoretically less volatile than the market if its beta value is less than 1.0. A portfolio having this stock in it is less risky than the same portfolio without it. Because they often move more slowly than market averages, utility stocks, for instance, frequently have low betas.
Beta Value Greater Than One
A beta value greater than 1.0 denotes a theoretically more variable price for the securities than the market. For instance, a stock is thought to be 20% more volatile than the market if its beta is 1.2. Small-cap and technology stocks frequently have betas that are larger than the market benchmark. This suggests that including the stock in a portfolio will raise the risk of the portfolio while also possibly raising the projected return.
Negative Beta Value
The betas of certain stocks are negative. A stock's inverse correlation to the market benchmark on a 1:1 basis is shown by a beta value of -1.0. The trends of the benchmark could be compared to the opposite, a mirror image of this stock. Negative betas are intended for put options and inverse ETFs. Additionally, a few industry groups, such as gold miners, frequently have negative betas.
Beta advantages
Beta is useful to CAPM adherents. It's crucial to take stock price volatility into account when determining risk. It makes sense to use beta as a stand-in for risk if you consider the risk to be the probability that a stock would depreciate in value. It makes a lot of sense logically. Consider a stock in a developing technology industry with a price that fluctuates more than the market. It's difficult to avoid the conclusion that this stock will be riskier than, say, a utility stock that is a safe haven and has a low beta.
Beta also provides a straightforward, quantitative indicator that is simple to use. Yes, there are differences in beta based on the market index utilized and the measurement period. However, in general, the idea of beta is rather simple. It's a useful tool for figuring out the costs of equity utilized in a valuation technique.
Beta disadvantages
Beta has many drawbacks if you are investing based on a stock's fundamentals.
Beta, to begin with, doesn't include fresh data. Take the example of a utility firm, Company X. Company X has a low beta and is regarded as a defensive stock. X's historical beta no longer accurately reflected the significant risks the company took on when it entered the merchant energy market and took on more debt.
However, many technology stocks are still fairly new to the market and lack the necessary price history to calculate a trustworthy beta.
The fact that past price movement is a poor indicator of future behavior is another unsettling aspect. Betas are essentially rear-view mirrors and don't reflect much of the future. Additionally, the beta metric for a single stock has the propensity to change over time, making it untrustworthy. Of course, beta is a decent risk metric for traders trying to purchase and sell equities quickly. It is less helpful for investors with long-term time horizons, though.
Examples of Beta
The standard deviation of returns for the asset could be divided by the standard deviation of returns for the benchmark to determine beta. The correlation between the security's and the benchmark's returns is multiplied by the resultant value.
Calculating Apple's Beta:
An investor wants to compare Apple's (AAPL) beta to that of the SPDR S&P 500 ETF Trust (SPY). The correlation between AAPL and SPY during the last five years is 0.83. The standard deviation of returns for AAPL is 23.42%, while the standard deviation of returns for SPY is 32.21%.
Beta of AAPL = 0.83 × (0.2342/0.3221) = 0.6035
Since AAPL's beta of 0.6035 suggests the stock theoretically experiences 40% less volatility than SPY, AAPL would be regarded as being less volatile than SPY in this situation.
Calculating Tesla's Beta:
Assume the investor also wishes to determine Tesla's (TSLA) beta in relation to SPY. Recent five-year statistics show that TSLA and SPY have a correlation of 0.032 and a variance of 0.015, respectively.
Beta of TLSA = (0.032/0.015) = 2.13
As a result, hypothetically, TSLA is 113% more volatile than SPY.
Risk assessment
The commonly used definition of risk is the potential for loss. Naturally, when investors think about risk, they are considering the possibility that the stock they buy will lose value. Problematically, beta does not differentiate between upward and downward price fluctuations when used as a risk proxy. The majority of investors view downward movements as a risk and upward ones as an opportunity. Investors cannot differentiate between the two using beta. That doesn't make a whole lot of sense for most investors.
Warren Buffett once said, "Well, that may be all right in reality, but it will never work in theory," which is an interesting statement regarding the academic community's view of value investment.
Beta is derided by value investors because it suggests that a stock that has experienced a severe decline in value is riskier now than it was earlier. A value investor would contend that a company offers a lower-risk investment when it experiences a decrease in value since investors may still purchase the same shares for a cheaper price even though its beta increased as a result of the decline. The stock's beta has nothing to do with the price paid for it in connection to underlying variables like shifts in management, the introduction of new products, or anticipated cash flows.
Because it contrasts a stock's return with the returns of the entire market, a stock's beta will fluctuate over time.
The "father of value investing," Benjamin Graham and his contemporary supporters looked for well-run businesses with a "margin of safety," or the capacity to tolerate bad surprises. Some safety factors are derived from the balance sheet, such as a low debt-to-total capital ratio. Some result from ongoing growth, earnings, or dividends. Avoiding overpaying has several significant benefits. For instance, companies with low multiples of earnings are often thought to be safer than those with high multiples, though this isn't always the case.
Beta in practice vs. Beta in theory
The beta coefficient theory makes the statistical assumption that stock returns are normally distributed. However, there could be a big surprise in the financial markets. Returns aren't always normally distributed in reality. Consequently, what a stock's beta may suggest about its potential future movement isn't necessarily accurate.
Even though a stock's price swings may be less pronounced, one with a very low beta may nonetheless be experiencing a long-term downturn. Therefore, adding stock in a downtrend with a low beta only reduces risk in a portfolio if the investor narrowly defines risk in terms of volatility (rather than as the potential for losses). Practically speaking, a down-trending low-beta stock is unlikely to boost the performance of a portfolio.
Similarly to this, a portfolio's risk will increase if a high beta stock is highly volatile in an upward trend, but it may also contribute to gains. Before assuming a stock will increase or decrease risk in a portfolio, it is advised that investors who use beta to evaluate a stock also evaluate it from other viewpoints, such as fundamental or technical characteristics.
In conclusion
Betas differ between businesses and industries. For instance, many utility stocks have betas below 1. On the other hand, many Nasdaq-listed high-tech equities have beta values larger than 1, which raises the chance of a higher rate of return but also increases risk.
Investors must distinguish between long-term risks and short-term dangers (where beta and price volatility are helpful) (where big-picture fundamental risk factors are more prevalent).
Low-beta stocks may be of interest to investors seeking low-risk investments because their values won't decline as sharply as the market as a whole during downturns. Nevertheless, during market upswings, the same equities won't increase as much as the market as a whole. Investors can evaluate their portfolio's ideal risk-reward ratio by computing and comparing betas.
FAQ
What is considered a good Beta for a stock?
Beta is used as a proxy for a stock's riskiness or volatility relative to the broader market. A good beta will, therefore, rely on your risk tolerance and goals. If you wish to replicate the broader market in your portfolio, for instance via an index ETF, a beta of 1.0 would be ideal. If you are a conservative investor looking to preserve principal, a lower beta may be more appropriate. In a bull market, betas greater than 1.0 will tend to produce above-average returns - but will also produce larger losses in a down market.
Is Beta a good risk assessment?
Many experts agree that while Beta provides some information about risk, it is not an effective measure of risk on its own. Beta only looks at a stock's past performance relative to the S&P 500 and does not provide any forward guidance. It also does not consider the fundamentals of a company or its earnings and growth potential.
How is a stock's Beta interpreted?
A Beta of 1.0 for a stock means that it has been just as volatile as the broader market (i.e., the S&P 500 index). If the index moves up or down 1%, so too would the stock, on average. Betas larger than 1.0 indicate greater volatility - so if the beta were 1.5 and the index moved up or down 1%, the stock would have moved 1.5%, on average. Betas less than 1.0 indicate less volatility: if the stock had a beta of 0.5, it would have risen or fallen just half a percent as the index moved 1%.
Which factors affect a Beta’s values?
- Nature of the business. Usually, the earnings of a company keep on fluctuating with time due to business cycles. The earnings may go up in the growth phase of the business cycle, while the earnings may go down when a firm is in the contraction phase. Therefore, the company's earnings are related to the conditions of business. In such circumstances, the accounting betas usually correlate with the market beta, which is based on share market returns and not the earnings.
- Financial leverage. Financial leverage is described as the debt portion of the financial structure of a company. It shows how much debt a company has taken to run the business. The more the debt, the greater the risk to the business organization. So, growth in financial leverage increases the financial risk. Therefore, this will increase the beta of a company’s stock as well.
- Operating leverage. Operating leverage is the change in economic earnings before tax and interest. Having operating leverage makes the companies be more volatile in terms of the management of assets. Firms with a higher operating lease are risky; consequently, their stocks have a higher beta.
Can Beta be affected by stock prices?
Beta indicates how volatile a stock's price is in comparison to the overall stock market. A beta greater than 1 indicates a stock's price swings more wildly (i.e., more volatile) than the overall market. A beta of less than 1 indicates that a stock's price is less volatile than the overall market.