Defining stock market volatility
The degree to which the value of the stock market as a whole goes up and down is measured by its volatility. Additionally, to the market as a whole, specific equities can also be regarded as volatile. More specifically, the amount by which an asset's price deviates from its average price can be used to determine volatility. The statistical metric that is frequently used to represent volatility is the standard deviation.
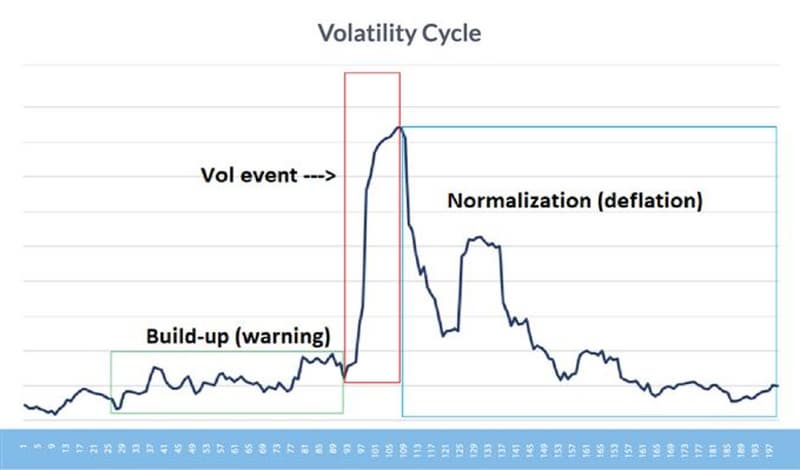
When unknown external events occur, stock market volatility may increase. For instance, the major market indices regularly rose and fell by more than 5% each day during the early phases of the COVID-19 pandemic, although typically not moving by more than 1% in a single day. Because no one knew what would happen, there was frenzied buying and selling.
More volatile stocks exist than others. A blue-chip company's stock may not experience many significant price changes, whereas a high-flying tech stock may. Tech stock is thought to have high volatility, while blue-chip stock is thought to have moderate volatility. There is a range of volatility called medium. A stock's volatility can also increase around important occasions, such as quarterly earnings announcements.
Fear often rises during bear markets, stock market crashes, and other big downward swings. Fear is commonly associated with volatility. Volatility, however, does not indicate direction. It only quantifies the size of price movements. Volatility might be considered a gauge of recent uncertainty.
While implied volatility is a number that depicts how volatile investors anticipate an asset to be in the future, historical volatility measures how volatile an asset was in the past. The prices of the put and call options can be used to compute implied volatility.
Is volatility important?
By comprehending how volatility functions, you may better position yourself to comprehend the overall state of the stock market, evaluate the risk associated with any given investment, and create a stock portfolio that is a great fit for your growth goals and risk tolerance.
But it's crucial to understand that risk and volatility are not the same things. Volatility and risk are closely related for stock traders who want to buy cheap and sell high each trading day. For people who might need to sell their investments soon, including those who are approaching retirement, volatility is also important. The daily swings of those companies, however, don't really relevant to long-term investors who often keep stocks for long periods of time. When you let your assets grow for a very long time into the future, volatility is merely noise.
Even yet, the dangers of long-term investing are more closely tied to being mistaken about a company's growth potential or paying too much for such growth than to volatility. Nevertheless, stock market volatility is a crucial idea that all investors need to understand.
Calculating volatility
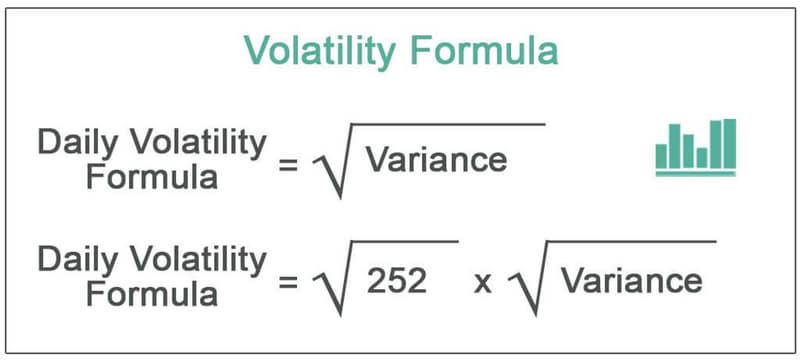
Calculating volatility frequently involves utilizing variance and standard deviation (the standard deviation is the square root of the variance). Simply double the standard deviation by the square root of the number of periods in question because volatility represents changes over a certain time period.
vol = σ√T
where:
- v = volatility over a period of time
- σ =standard deviation of returns
- T = number of periods in the specified time horizon
Let's say, for the sake of simplicity, that monthly stock closing prices range from $1 to $10. For instance, the first month costs $1, the second costs $2, and so on. Compute variance by using the five procedures shown below.
- Find the data set's mean. This entails adding up all the values and then dividing the result by the total. $55 is the result of adding $1, $2, 3, and so on up to $10. Since our data collection contains 10 numbers, this is divided by 10. This results in an average price, or mean price, of $5.50.
- Find the variation between each data point and the mean. This is frequently known as deviation. Consider the following examples: $10 - $5.50 = $4.50; $9 - $5.50 = $3.50. This goes on down to the very first data value of $1. Numbers can be negative. These calculations are often carried out in a spreadsheet because we require each value.
- the deviations are squared. Negative numbers will be removed as a result.
- The squared deviations should be added. The result in our example is 82.5.
- Divide the total number of data values by the sum of the squared variances (82.5).
The difference that results in this situation is $8.25. To calculate the standard deviation, one takes the square root. This comes to $2.87. This risk indicator displays how values are distributed around the average price. It provides traders with a sense of how much a price might vary from the average.
68% of all data values, when randomly selected from a normal distribution of prices, will fall within one standard deviation. In our case, 95 percent of data values will be within two standard deviations (2 x 2.87), and 99.7 percent of all values will be within three standard deviations (3 x 2.87). In this instance, the range of values from $1 to $10 is evenly distributed rather than dispersed randomly along a bell curve. Therefore, the predicted percentages of 68%-95%o-99.7% do not hold. Despite this drawback, traders typically employ standard deviation since price return data sets frequently resemble a normal (bell curve) distribution more than in the example provided.
VIX Definition
The VIX, also known as the "fear index," is the most well-known gauge of stock market volatility. It gauges investors' expectations for the movement of stock prices over the following 30 days based on the trading of S&P 500 options. The VIX shows how much trading participants anticipate the S&P 500 prices to fluctuate over the course of the following month, either upwards or downwards.
In general, the options cost more the higher the VIX. This is due to a few factors: First, keep in mind that puts are a sort of option that enables traders to agree to sell shares, in this example of the S&P 500, at a specific price at a specific time. As the likelihood that the S&P 500 will decline in value rises, these puts become more desirable (and pricey). They profit if the S&P 500 declines below the selling price of their puts.
Because the stock market typically experiences more significant fluctuations in value up or down when things are generally heading lower, the rising value of these puts thus becomes a bellwether of projected market declines—and by extension volatility.
The S&P 500 will typically deviate from its average growth rate by no more than 20% when the VIX is historically in the low 20s. But during the past ten years, the VIX has decreased.
According to Freddy Garcia, a CFP in Naperville, Illinois, "most likely this was due to the long-term bull market over the past decade, which has produced complacency among market participants." When markets are tense, the VIX will momentarily print in the 40s or 50s as investors rush to buy protection for their portfolios. As economic apprehension over the coronavirus started to spread in March 2020, VIX values reached a high of 82.69.
What are the types of volatility?
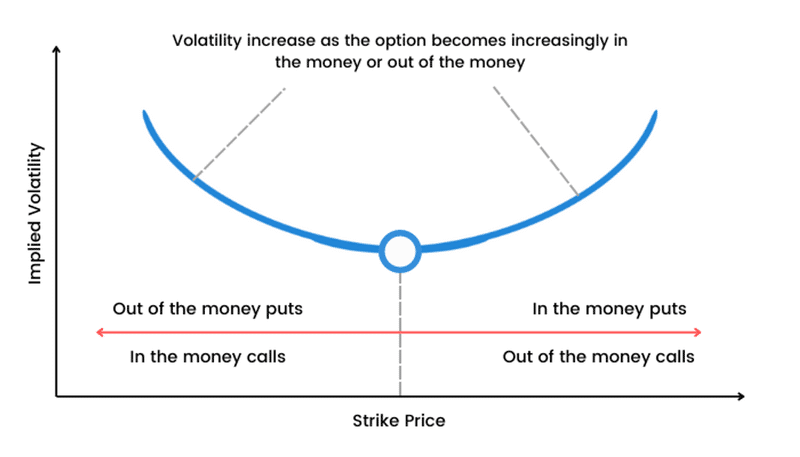
Implied Volatility
A key indicator for options traders is implied volatility (IV), also known as predicted volatility. As the name implies, it enables them to predict how volatile the market will be in the future. Additionally, this idea offers traders a mechanism to compute likelihood. It's vital to keep in mind that since it shouldn't be regarded as a science, it cannot predict how the market will behave in the future.
Contrary to historical volatility, implied volatility, which reflects predictions for future volatility, is derived from the price of an option. Traders are unable to utilize previous performance as a predictor of future performance since it is implied. Instead, they must make an assessment of the option's market potential.
Trading in options has implied volatility as a crucial component.
Historical Volatility
Historical volatility (HV), also known as statistical volatility, measures price changes across predefined time periods to estimate the fluctuations of underlying securities. Compared to implied volatility, it is the less used statistic because it is backward-looking.
The price of an investment will fluctuate more than usual when historical volatility increases. There is a current expectation that something will change or already has. On the other hand, if historical volatility is declining, it indicates that all uncertainty has been removed and that things have returned to normal.
Although this estimate may be based on intraday fluctuations, it frequently gauges moves as the difference between two closing prices. Historical volatility can be calculated in steps of 10 to 180 trading days, depending on the anticipated length of the options trade.
Market volatility – how much is normal?
Markets regularly experience times of increased volatility. As an investor, you should anticipate a 15% fluctuation from the average returns over the course of a year.
You can anticipate a market decline of around 30% every five years, according to Lineberger. "This kind of volatility is ordinary; if you can't take that, you really shouldn't be an equity investor."
The stock market is generally tranquil, with sporadic shorter bursts of above-average market volatility. In general, stock prices don't fluctuate constantly; rather, there are extended stretches of little excitement followed by brief spikes in price movement. The volatility average is skewed higher at these times than it would normally be.
Bearish (downward-trending) markets frequently include unpredictable price movements, which are typically downward, while bullish (upward-trending) markets normally have minimal volatility.
This is how it operates, says Lineberger. And if you can handle it, you can take pleasure in outpacing inflation by approximately three times annually. The best advice I can provide is to accept volatility and recognize that it's common.
How can you handle market volatility?
You can respond in a variety of ways to the ups and downs of your portfolio. But one thing is certain: After a significant market decline, experts do not advise panic selling.
The first 12 months after a 20% or greater stock market decline since 1970, according to experts at the Schwab Center for Financial Research, were when equities produced the biggest gains. Therefore, your assets would have missed out on big rebounds and may never have regained the value they lost if you had jumped out at the bottom and then waited to get back in.
Try one of these methods instead when market volatility has you on edge:
Remember your long-term plan
A well-balanced, diversified portfolio was really created with times like these in mind because investing is a long-term game. If you need your money soon, don't put it in the market, where volatility may make it difficult for you to withdraw it quickly. But volatility is a necessary component of the journey to considerable growth for long-term objectives.
According to Gage Paul, CFP, a financial planner in Hudson, Ohio, "Volatility is the cost you pay when investing in assets that provide you the highest chance of accomplishing long-term goals." It is expected and might be considered a cost of achieving these objectives.
Consider market volatility an opportunity
Consider how much stock you can buy while the market is in a negative downward situation. This may assist you to cope with market volatility mentally.
Periods of volatility really allow us the opportunity to buy these stocks at a reduced price, especially in the case of stocks that have been profitable over the past few years, according to Garcia.
For example, after more than a decade of steady growth, you could have purchased shares of an S&P 500 index fund during the bear market of 2020 for nearly a third of the price they were a month earlier. Your investment would have increased by roughly 65% from its low and 14% from the start of the year by the end of the year.
Keep a health emergency fund
Market turbulence isn't a concern unless you need to sell an investment since you could have to do so in a bear market. For this reason, it's crucial for investors to have an emergency fund that can cover three to six months' worth of living expenditures.
In times of market volatility, Wirick explains, "We set aside a suitable emergency fund so clients do not have to worry about selling down investments to cover cash demands." "This gives clients piece of mind."
Planners advise having an even larger safety net, up to two years' worth of non-market associated assets, if you're close to retiring. Bonds, cash, the cash value in life insurance, home equity lines of credit, and mortgages using home equity as collateral are all included.
According to Benjamin Offit, CFP, a financial counselor in Towson, Maryland, "when the market is down, pull money from those and wait for the market to return before withdrawing from your portfolio."
Whenever necessary, rebalance your portfolio.
Because market volatility can lead to abrupt changes in investment values, it's possible that following periods of rapid fluctuations in, either way, your asset allocation will stray from your targeted divisions.
You should rebalance your portfolio during these times to get it back in line with your investment objectives and the level of risk you prefer. When you rebalance, you should sell some of the asset class that has unintentionally grown to comprise a larger portion of your portfolio and use the proceeds to purchase more of the asset class that has shrunk too much. When your allocation deviates by 5% or more from your original target mix, it's a good idea to rebalance.
If an asset class shows a divergence of more than 20%, you might also want to rebalance. You could wish to adjust your holdings if, for example, your goal is for emerging market equities to make up 10% of your portfolio but, following a significant market movement, you find that emerging markets make up more like 8% or 12%.
The bottom line
Being apprehensive during times of market volatility is common. Seeing significant—or even minor—losses on paper might be unsettling. However, you must ultimately keep in mind that market turbulence is a common aspect of investment and that the businesses you invest in will react to a crisis.
According to Lineberger, "Companies are highly resilient; they are great at dealing through whatever issue may be occurring." "While it may be tempting to succumb to that fear, I would advise people to maintain their composure. History serves as our guide, and it has been incredibly successful for those who are patient and disciplined. Even with the Great Recession and other times of high volatility, the long-term average annual returns on the U.S. stock market have been around 10%.
FAQ
What is volatility as a mathematical definition?
Volatility is a statistical indicator of how data are distributed about their mean over time. It is determined by multiplying the standard deviation by the square root of the total number of time periods, T. It depicts this variation in market prices on a yearly basis in finance.
Are volatility and risk the same?
Although volatility is frequently used to describe risk, this is not always the case. Risk is the possibility of suffering a loss, whereas volatility is the size and speed of price movements. Risk increases if those higher price swings also raise the likelihood of losses.
Is it good for a market to have volatility?
Depending on your risk appetite and the type of trader you are, volatility may be good or bad for you. Volatility can cause problems for long-term investors, but for day traders and options traders, it frequently means more trading chances.
What does high volatility mean?
When volatility is strong, prices are moving swiftly and steeply in both directions.
What are some examples of volatility?
Let's say an investor is putting together a portfolio for retirement. She is looking for equities with low volatility and consistent returns because she plans to retire in the next several years. She weighs two businesses:
- ABC Corp. is marginally less volatile than the S&P 500 index with a beta coefficient of.78.
- XYZ, Inc. is much more volatile than the S&P 500 index, with a beta coefficient of 1.45.
A less risk-taking investor would choose a corporation for their portfolio because of its lower volatility and better short-term value predictability.