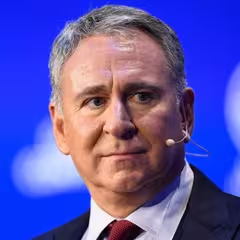
Ken Griffin Citadel Advisors
Ken Griffin founded Citadel, one of the world’s largest and most successful hedge funds. Starting his trading career from his Harvard dorm room at a young age, Griffin quickly developed a keen sense for markets and built Citadel into a global powerhouse with billions in assets under management. Known for his quantitative and technology-driven strategies, Griffin has also made headlines for significant philanthropic contributions, supporting causes in education, the arts, and public institutions. Over the years, he has earned recognition as one of the preeminent figures in modern finance.
Top Buys
| Rank | Stock | Value |
|---|---|---|
| 1 |

iShares Core S&P 500 ETF
IVV
|
+$9.9B |
| 2 |

SpaceX
SPCX
|
+$871M |
| 3 |

Eli Lilly
LLY
|
+$719M |
| 4 |

Amazon
AMZN
|
+$698M |
| 5 |

Netflix
NFLX
|
+$627M |
Top Sells
| Rank | Stock | Value |
|---|---|---|
| 1 |

Micron Technology
MU
|
+$3B |
| 2 |

State Street SPDR Dow Jones Industrial Average ETF Trust
DIA
|
+$1.54B |
| 3 |

TSMC
TSM
|
+$1.42B |
| 4 |

NVIDIA
NVDA
|
+$1.41B |
| 5 |

Sandisk
SNDK
|
+$771M |
Sector Composition
| Rank | Sector | Weight |
|---|---|---|
| 1 | Miscellaneous | 82.67% |
| 2 | Technology | 3.92% |
| 3 | Healthcare | 2.55% |
| 4 | Industrials | 2.26% |
| 5 | Financials | 2.13% |
| Name | Market Value | Portfolio Weight | Shares or Principal |
Change in Stake | Capital Flow | Held Since | |
|---|---|---|---|---|---|---|---|

201
CALL
iShares China Large-Cap ETF
FXI
$3.89B
| $631M | 0.07% |
19,979,300
+3,255,300
| +19% | +$116M |
2016 Q3
39 quarters
|
|

202
Meta Platforms (Facebook)
META
$1.61T
| $631M | 0.07% |
1,120,322
-709,415
| -39% | -$434M |
2017 Q1
37 quarters
|
|

203
CALL
VanEck Gold Miners ETF
GDX
$26.3B
| $630M | 0.07% |
8,355,000
+210,700
| +3% | +$18.6M |
2014 Q1
49 quarters
|
|

204
CALL
iShares iBoxx $ Investment Grade Corporate Bond ETF
LQD
$32.5B
| $624M | 0.07% |
5,721,900
+4,013,600
| +235% | +$437M |
2016 Q3
39 quarters
|
|

205
Walmart Inc
WMT
$997B
| $624M | 0.07% |
5,509,526
+4,292,801
| +353% | +$533M |
2025 Q2
4 quarters
|
|

206
Lam Research
LRCX
$295B
| $616M | 0.07% |
1,420,975
+306,243
| +27% | +$93M |
2013 Q2
52 quarters
|
|

207
Texas Instruments
TXN
$283B
| $613M | 0.07% |
2,055,598
+1,688,083
| +459% | +$468M |
2020 Q2
24 quarters
|
|

208
CALL
Chevron
CVX
$416B
| $604M | 0.07% |
3,645,072
-570,794
| -14% | -$106M |
2013 Q2
52 quarters
|
|

209
PUT
ServiceNow
NOW
$107B
| $602M | 0.07% |
6,059,200
+1,901,200
| +46% | +$188M |
2013 Q2
52 quarters
|
|

210
PUT
iShares Bitcoin Trust
IBIT
$59.9B
| $595M | 0.07% |
17,863,400
+6,728,400
| +60% | +$274M |
2024 Q4
6 quarters
|
|

211
PUT
Nike
NKE
$56.9B
| $591M | 0.07% |
14,399,200
+3,392,400
| +31% | +$149M |
2013 Q2
52 quarters
|
|

212
United Airlines
UAL
$38.5B
| $589M | 0.07% |
4,331,239
+236,448
| +6% | +$24.5M |
2016 Q2
40 quarters
|
|

213
Intel
INTC
$332B
| $589M | 0.07% |
4,218,311
-2,105,435
| -33% | -$213M |
2020 Q4
22 quarters
|
|

214
PUT
State Street Technology Select Sector SPDR ETF
XLK
$116B
| $588M | 0.07% |
3,084,200
+290,000
| +10% | +$49.6M |
2014 Q1
49 quarters
|
|

215
CALL
Bank of America
BAC
$350B
| $587M | 0.07% |
10,296,600
-1,222,500
| -11% | -$65M |
2013 Q2
52 quarters
|
|

216
CALL
Home Depot
HD
$350B
| $580M | 0.07% |
1,645,900
+170,600
| +12% | +$55.5M |
2013 Q2
52 quarters
|
|
|
217
Chevron
CVX
$416B
| $580M | 0.07% |
3,496,126
+2,069,743
| +145% | +$385M |
2013 Q4
50 quarters
|
|

218
CALL
Rocket Lab Corp
RKLB
$44.5B
| $579M | 0.07% |
5,700,900
+1,382,100
| +32% | +$138M |
2021 Q3
19 quarters
|
|

219
PUT
PayPal
PYPL
$49.4B
| $577M | 0.07% |
13,367,000
+2,725,300
| +26% | +$124M |
2015 Q3
43 quarters
|
|

220
CALL
TeraWulf
WULF
$6.7B
| $576M | 0.07% |
23,322,700
+10,307,100
| +79% | +$237M |
2023 Q2
12 quarters
|
|

221
PUT
Booking.com
BKNG
$119B
| $574M | 0.07% |
3,221,600
-2,145,900
| -40% | -$366M |
2013 Q2
52 quarters
|
|

222
PUT
State Street Energy Select Sector SPDR ETF
XLE
$41.6B
| $568M | 0.06% |
10,693,800
-3,524,900
| -25% | -$202M |
2016 Q3
39 quarters
|
|

223
ExxonMobil
XOM
$680B
| $558M | 0.06% |
4,083,577
+2,775,621
| +212% | +$415M |
2025 Q3
3 quarters
|
|

224
Wells Fargo
WFC
$258B
| $557M | 0.06% |
6,738,530
+4,484,296
| +199% | +$360M |
2014 Q3
47 quarters
|
|

225
PUT
DELISTED
Warner Bros
WBD
| $555M | 0.06% |
20,820,800
+16,950,700
| +438% | +$459M |
2017 Q1
37 quarters
|
|
Similar funds


Ken Griffin's Q2 2026 Portfolio in Review
As of Q2 2026, Ken Griffin held 15,445 positions worth $875B, up 41% from $618B the previous quarter. Its ten largest holdings account for 23% of the portfolio.
Ken Griffin's Q2 2026 filing shows 2,573 new, 6,088 increased, 4,803 reduced and 1,873 closed positions. Its largest new stake was SpaceX: 5,129,884 shares worth $876M. The largest sale was Micron Technology, an estimated $3B.
By sector, the portfolio is most concentrated in Miscellaneous at 83% of assets, up from 79% a quarter earlier, followed by Technology and Healthcare.
- Ken Griffin's largest Q2 2026 buy was SpaceX: 5,129,884 shares worth $876M.
- Ken Griffin added most to iShares Core S&P 500 ETF in Q2 2026, an estimated $9.9B increase.
- Ken Griffin's biggest Q2 2026 reduction was Micron Technology, cutting an estimated $3B.
- Ken Griffin fully exited iShares 7-10 Year Treasury Bond ETF in Q2 2026, selling an estimated $325M.
- Ken Griffin's ten largest holdings make up 23% of its $875B portfolio in Q2 2026.
- Ken Griffin opened 2,573 new positions and closed 1,873 in Q2 2026.
- Ken Griffin's portfolio value rose 41% quarter-over-quarter to $875B.
Based on Citadel Advisors's 13F filing for Q2 2026, filed 14 Aug 2026.