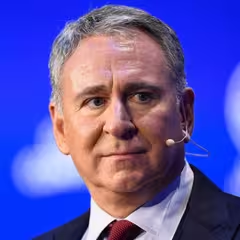
Ken Griffin Citadel Advisors
Ken Griffin founded Citadel, one of the world’s largest and most successful hedge funds. Starting his trading career from his Harvard dorm room at a young age, Griffin quickly developed a keen sense for markets and built Citadel into a global powerhouse with billions in assets under management. Known for his quantitative and technology-driven strategies, Griffin has also made headlines for significant philanthropic contributions, supporting causes in education, the arts, and public institutions. Over the years, he has earned recognition as one of the preeminent figures in modern finance.
Top Buys
| Rank | Stock | Value |
|---|---|---|
| 1 |

iShares Core S&P 500 ETF
IVV
|
+$9.9B |
| 2 |

SpaceX
SPCX
|
+$871M |
| 3 |

Eli Lilly
LLY
|
+$719M |
| 4 |

Amazon
AMZN
|
+$698M |
| 5 |

Netflix
NFLX
|
+$627M |
Top Sells
| Rank | Stock | Value |
|---|---|---|
| 1 |

Micron Technology
MU
|
+$3B |
| 2 |

State Street SPDR Dow Jones Industrial Average ETF Trust
DIA
|
+$1.54B |
| 3 |

TSMC
TSM
|
+$1.42B |
| 4 |

NVIDIA
NVDA
|
+$1.41B |
| 5 |

Sandisk
SNDK
|
+$771M |
Sector Composition
| Rank | Sector | Weight |
|---|---|---|
| 1 | Miscellaneous | 82.67% |
| 2 | Technology | 3.92% |
| 3 | Healthcare | 2.55% |
| 4 | Industrials | 2.26% |
| 5 | Financials | 2.13% |
| Name | Market Value | Portfolio Weight | Shares or Principal |
Change in Stake | Capital Flow | Held Since | |
|---|---|---|---|---|---|---|---|
|
51
Amazon
AMZN
$2.8T
| $2.59B | 0.3% |
10,882,003
+2,779,466
| +34% | +$698M |
2017 Q1
37 quarters
|
|

52
PUT
Goldman Sachs
GS
$250B
| $2.53B | 0.29% |
2,504,000
+57,400
| +2% | +$56M |
2013 Q2
52 quarters
|
|

53
CALL
Marvell Technology
MRVL
$127B
| $2.47B | 0.28% |
8,280,500
+4,675,900
| +130% | +$938M |
2013 Q2
52 quarters
|
|
|
54
NVIDIA
NVDA
$4.51T
| $2.36B | 0.27% |
11,815,467
-6,849,394
| -37% | -$1.41B |
2016 Q2
40 quarters
|
|

55
PUT
UnitedHealth
UNH
$353B
| $2.34B | 0.27% |
5,631,800
-1,804,900
| -24% | -$669M |
2013 Q2
52 quarters
|
|

56
CALL
Caterpillar
CAT
$256B
| $2.3B | 0.26% |
2,156,800
+123,900
| +6% | +$109M |
2013 Q2
52 quarters
|
|
|
57
CALL
Eli Lilly
LLY
$1.21T
| $2.26B | 0.26% |
1,881,500
+160,400
| +9% | +$164M |
2013 Q2
52 quarters
|
|
|
58
CALL
Netflix
NFLX
$260B
| $2.25B | 0.26% |
31,570,900
+5,058,200
| +19% | +$445M |
2013 Q2
52 quarters
|
|
|
59
CALL
State Street SPDR Dow Jones Industrial Average ETF Trust
DIA
$44.6B
| $2.15B | 0.25% |
4,118,000
+3,177,600
| +338% | +$1.59B |
2014 Q1
49 quarters
|
|
|
60
PUT
Netflix
NFLX
$260B
| $2.15B | 0.25% |
30,113,400
-11,086,100
| -27% | -$976M |
2013 Q2
52 quarters
|
|

61
PUT
Applied Materials
AMAT
$264B
| $2.14B | 0.25% |
2,965,600
+1,896,000
| +177% | +$875M |
2013 Q2
52 quarters
|
|

62
Apple
AAPL
$4.98T
| $2.11B | 0.24% |
7,296,076
+2,082,206
| +40% | +$596M |
2013 Q2
52 quarters
|
|

63
PUT
CrowdStrike
CRWD
$222B
| $2.1B | 0.24% |
10,984,400
+4,240,000
| +63% | +$602M |
2019 Q2
28 quarters
|
|

64
PUT
Dell
DELL
$209B
| $2.08B | 0.24% |
4,828,400
+611,900
| +15% | +$177M |
2019 Q1
29 quarters
|
|
|
65
CALL
CrowdStrike
CRWD
$222B
| $2B | 0.23% |
10,460,000
-600,400
| -5% | -$85.3M |
2019 Q2
28 quarters
|
|

66
CALL
JPMorgan Chase
JPM
$888B
| $1.9B | 0.22% |
5,809,800
+114,100
| +2% | +$35.4M |
2013 Q2
52 quarters
|
|

67
CALL
ASML
ASML
$549B
| $1.9B | 0.22% |
953,600
-238,700
| -20% | -$380M |
2016 Q2
40 quarters
|
|

68
PUT
Arm
ARM
$187B
| $1.9B | 0.22% |
5,345,100
+1,794,700
| +51% | +$477M |
2023 Q3
11 quarters
|
|

69
CALL
iShares iBoxx $ High Yield Corporate Bond ETF
HYG
$17.6B
| $1.81B | 0.21% |
22,676,400
+12,361,900
| +120% | +$989M |
2016 Q3
39 quarters
|
|

70
PUT
Lam Research
LRCX
$251B
| $1.78B | 0.2% |
4,101,500
+2,122,800
| +107% | +$644M |
2013 Q2
52 quarters
|
|

71
CALL
Berkshire Hathaway Class B
BRK.B
$1.22T
| $1.77B | 0.2% |
3,531,700
+954,600
| +37% | +$459M |
2013 Q2
52 quarters
|
|
|
72
CALL
Applied Materials
AMAT
$264B
| $1.76B | 0.2% |
2,433,000
+568,200
| +30% | +$262M |
2013 Q2
52 quarters
|
|

73
CALL
Palantir
PLTR
$386B
| $1.75B | 0.2% |
14,969,500
-4,460,300
| -23% | -$608M |
2020 Q4
22 quarters
|
|

74
CALL
iShares Silver Trust
SLV
$25.2B
| $1.68B | 0.19% |
31,327,400
-15,166,900
| -33% | -$1.01B |
2014 Q1
49 quarters
|
|

75
PUT
State Street Financial Select Sector SPDR ETF
XLF
$53.3B
| $1.64B | 0.19% |
30,560,700
-2,017,700
| -6% | -$105M |
2014 Q1
49 quarters
|
|
Similar funds


Ken Griffin's Q2 2026 Portfolio in Review
As of Q2 2026, Ken Griffin held 15,445 positions worth $875B, up 41% from $618B the previous quarter. Its ten largest holdings account for 23% of the portfolio.
Ken Griffin's Q2 2026 filing shows 2,573 new, 6,088 increased, 4,803 reduced and 1,873 closed positions. Its largest new stake was SpaceX: 5,129,884 shares worth $876M. The largest sale was Micron Technology, an estimated $3B.
By sector, the portfolio is most concentrated in Miscellaneous at 83% of assets, up from 79% a quarter earlier, followed by Technology and Healthcare.
- Ken Griffin's largest Q2 2026 buy was SpaceX: 5,129,884 shares worth $876M.
- Ken Griffin added most to iShares Core S&P 500 ETF in Q2 2026, an estimated $9.9B increase.
- Ken Griffin's biggest Q2 2026 reduction was Micron Technology, cutting an estimated $3B.
- Ken Griffin fully exited iShares 7-10 Year Treasury Bond ETF in Q2 2026, selling an estimated $325M.
- Ken Griffin's ten largest holdings make up 23% of its $875B portfolio in Q2 2026.
- Ken Griffin opened 2,573 new positions and closed 1,873 in Q2 2026.
- Ken Griffin's portfolio value rose 41% quarter-over-quarter to $875B.
Based on Citadel Advisors's 13F filing for Q2 2026, filed 14 Aug 2026.