
Wall Street analysts – what do they do?
Wall Street equity analysts carry out an in-depth study on the management and operations of publicly traded corporations. They then compile their results to produce ratings for those businesses.
For the purpose of assembling a truthful image of publicly traded corporations, these analysts acquire and analyze a wide range of resources. The following are some sources where they might get information:
- The SEC (Securities and Exchange Commission)
- Meetings with the corporate leadership
- Communications with clients and suppliers
Analysts' research is aided by financial statements. They participate in executive-led conference calls as well. To assess a company's current state of health and anticipated future growth and revenue, analysts look at its fundamentals. Any company-specific news or developments, such as a change in management or a quarter's earnings, should be monitored by equity analysts.
Analysts keep an eye on the general health of the industries in which they specialize. This informs them of significant industry-wide developments that might affect the stock value of certain businesses or funds within that sector.
Regarding investors, some experts publish internet analyses without charge, but many do it at a fee of $15 to hundreds of dollars. People using subscription-based services might also need to subscribe to a paid plan in order to obtain analyst predictions. Analysts may be paid based on the agreements that come about as a result of their reports or based on profitability.

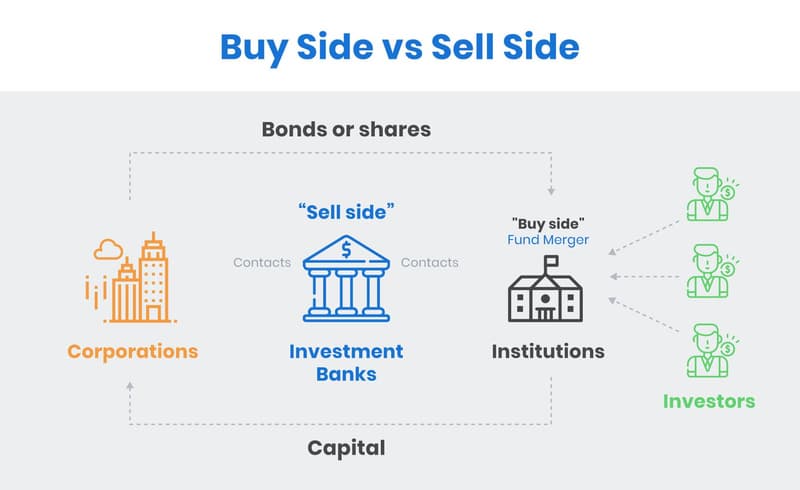
The types of analysts
Buy-side analysts, sell-side analysts, and independent analysts are the three main categories of equities analysts who rate publicly traded firms.
- Sell-side analysts: Brokerages employ these individuals. Customers receive their studies, and some go on to invest in businesses.
- Buy-side analysts: Pension funds and fund managers hire buy-side analysts, who typically have a narrow area of expertise.
- Independent analysts: As the name implies, independent analysts do their own stock analysis and are not employed by fund managers or brokerages.
Stock rating definition
A stock rating is a way to gauge how well a stock has performed over a certain period of time.
When making stock recommendations to professional stock traders and ordinary investors, analysts and brokerage firms rely on these ratings.
To arrive at their conclusions, analysts consult the financial accounts of various businesses, speak with management and clients, or listen to conference calls held by such businesses. These ratings are typically released every three months, or once per quarter.
Traders can better comprehend a stock's intrinsic value by comparing it to its target price, which is included in stock ratings.
By examining financial data, listening to quarterly conference calls, and assessing the management of the company, research analysts make recommendations on the stock.
For a comprehensive understanding of how the company is faring in comparison to its prior performance and its competitors, these analysts can even get in touch with the management and its clients directly.
To learn more about the company's future prospects, research analysts also undertake surveys and other types of study.
Following the analysis, these investment banks and analysts publish thorough research reports on the stock.
How do analysts and investors read stock ratings?
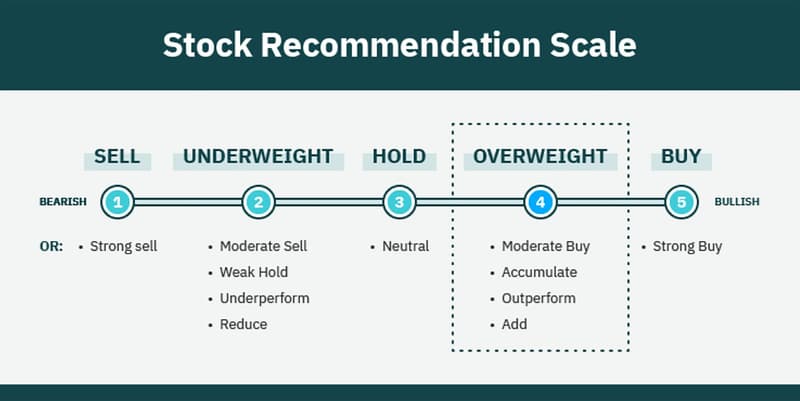
All the various analyst rating words can be categorized into seven broad groups to make things easier:
Buy Rating
A buy rating indicates that experts believe a stock's price will increase in the near- to medium term and is a recommendation for purchasing that stock.
The analysts typically believe that the company can outperform the return of comparable companies in the same industry due to factors like the introduction of a new good or service.
Sell Rating
A sell rating, which is a recommendation to sell a specific stock, indicates that the analyst believes the price of the stock will drop in the near- or medium-term below its current level.
When a stock has a strong sell rating, analysts believe that its price will soon fall dramatically below where it is at this time.
If any analysts issue a strong sell recommendation on any stock, a particular company risks losing important clients.
Hold
When an analyst assigns a hold rating to stock, they anticipate that it will perform similarly to the market or compare stocks in the same industry.
This grade instructs stock brokers to hold the stock rather than buy or sell it.
Stock is given a hold rating when there is ambiguity surrounding a company, such as new products or services.
Underperform
An underperform rating indicates that the company may do marginally worse than the benchmark index or the market average. Therefore, research analysts advise traders to avoid the stock.
A stock would have outperformed the index by 3%, for instance, if its total return was 3% and the Nifty's total return was 6%.
Outperform
A stock that is expected to deliver returns that are higher than the market average or a benchmark index is given an outperform rating.
A stock has exceeded the index by 4%, for instance, if its total return is 10% while the total return of the Dow Jones Industrial Average is 6%.
Overweight
When a stock is rated overweight, it typically signifies that the benchmark's current weighting for that stock is too low. An equities analyst who gives a stock an overweight rating thinks the price of the company's stock will perform better in the future.
Underweight
Analysts' recommendations to sell or avoid buying particular equities are referred to as "underweight." It indicates that they predict negative performance for the stock over the next 12 months. Depending on the state of the market, this could indicate a decline in value or slow growth, but it always indicates that the analyst expects the stock to perform worse than the market.
The analyst rating scale is a little trickier than the conventional "buy, hold, and sell" classifications, as described above. There are numerous terms for each of the ratings (for example, "sell" can also be referred to as "strong sell," and "buy" can also be referred to as "strong buy") as well as two new terms: underperform and outperform.
While to top it off, not every company uses the same rating system: a rating of "outperform" for one company can be a rating of "buy" for another, and a rating of "sell" might be a rating of "market perform" for still another. Therefore, it is advised to check the issuing firm's rating scale before using ratings in order to fully comprehend the meaning of each phrase.
Examples of analyst ratings based on stock performance
It is essential to evaluate the veracity of analyst evaluations in order to fully comprehend them.
Coca-Cola
Coke explodes on July 30, 2010, climbing from $17.39 to $32.75 on December 30, 2010, an 88% increase.
Analyst Recommendation
UBS changed its rating for Coke from "neutral" to "buy" on March 4, 2010.
Starbucks
Starbucks falls from $18.88 to $4.73 between October 1, 2006, and December 1, 2008—a decrease of over 75%. Although the corporation is also suffering from whole-roasted over-expansion, the recessionary forces can be somewhat to blame for this double shot of decline.
Analyst Recommendation
That fall and winter, Friedman Billings Ramsey, UBS, and Robert W. Baird all released a ton of recommendations. Both Friedman and Baird began their coverage with a "outperform" rating. On October 10, 2006, UBS was the only brokerage to lower the stock from "buy" to "neutral," but two months later they upgraded to "buy.”
Apple
From a low of $0.29 on December 9, 1998, Apple stock begins to rise, reaching an all-time high of $1.12 on March 30, 2000.
Analyst Recommendation
In the months of the spring through the fall of 1998, Bear Stearns and J.P. Morgan upped their recommendations to "buys," Robert Cohen dropped to a "neutral," and three additional companies began coverage with two "holds," a "buy," and a "neutral." That amounts to three buys, two holds, and two neutrals for those keeping score at home.
How accurate are analyst ratings?
Some Wall Street analyst predictions are very correct, which results in profitable returns for investors. But nothing on the stock market is actually guaranteed. Investors should therefore approach the interpretation of analyst ratings with a fair dose of skepticism.
According to TipRanks, its top 25 experts had a 67.6% success rate from 2011 to 2020, producing gains that outperformed the index by 21% during that time period. Joseph Foresi of Cantor Fitzgerald held the position of the highest-ranking analyst at that time, with an 89% success rate.
Timing of analyst recommendations is important since variables affecting stock value can change quickly and ratings aren't always current when you find them.
Compared to normal individuals, Wall Street analysts are more skilled at evaluating the data for each of their target organizations. They will probably be able to offer a more thorough examination than you would be able to. Think of a sector-focused analyst who is well-versed in both the individual companies themselves and the overall competitive landscape of that vertical. Even if you take a certain analyst's advice, such expertise does not ensure a specific level of performance or returns.
Keep in mind that analyst reports aren't constantly updated due to the rapid movement of the stock market. Think about utilizing some of the more modern evaluation techniques, such as reading a stock chart or keeping an eye on the news.
Is it advisable to invest solely based on analyst ratings?
You should use caution when reading analyst ratings and recommendations because they regularly get things wrong.
Isolated media claims about analyst ratings shouldn't be taken seriously. A single rating from a single analyst doesn't really significant, but the financial media frequently makes a big deal out of them to garner clicks.
Conflicts of interest are also possible for stock analysts. The ratings may be impacted if the companies they work for have ownership stakes in the stocks.
Under no circumstances should you buy or sell stocks based only on stock analyst recommendations. It is essential to conduct an independent study and draw your own findings.
Revenue and EPS forecasts from analysts are frequently fairly accurate. Their price targets and buy/sell/hold advice, however, are completely unreliable.
This is not to say that analysts are incompetent in their work. Instead, it illustrates how difficult it is to forecast short-term changes in stock values.
Conclusion
Wall Street analysts do in-depth research on specific companies before making recommendations to investors. Investors may find their study to be a useful tool when making decisions about their stock ownership. However, analysts occasionally make mistakes since they are not perfect. Take into account analyst recommendations as a component of a more comprehensive investment plan that also accounts for the timeliness, bias, individual objectives, and diversification.
FAQ
Do buy-side or sell-side analysts issue stock ratings?
Investment banks employ sell-side analysts, who will make recommendations such as "strong buy," "outperform," "neutral," or "sell." Instead, buy-side analysts select investments in line with the investment strategy of funds or investment firms for which they work.
Why do some analysts use “outperform”, while others use “buy”?
There is no common recommendation system among sell-side businesses; instead, several investment banks each have their own internal rating system. As a result, one bank may provide a rating of "buy" that is equivalent to a "outperform" rating from another bank. In all situations, the analysts came to the conclusion that the stock in question ought to provide returns greater than those of the whole market.
If a stock receives a “sell” rating, should I sell it?
Based on fundamental and econometric studies of a firm and its prospects for the future, analysts determine their ratings. Analysts, however, may err or miscalculate. You should therefore take into account the consensus of suggestions from numerous expert specialists. You might want to think about reducing or liquidating your position in that stock if they all (or primarily) advise "sell.”
Do analysts rate cryptocurrencies?
For Coinbase Global, a publicly traded cryptocurrency exchange, ratings are provided. This fall, JMP Securities started covering its shares and even gave it a buy recommendation. However, the majority of financial experts don't rate digital coins directly.
Overall, cryptocurrency is still seen as a developing alternative asset and has not yet experienced significant mainstream adoption. Cryptocurrency prices are notoriously erratic; just take a look at Shiba Inu (SHIB), which plunged 15% on October 28, 2021, after increasing by about 130% in the week before. Even while it pales in comparison to the gains from a year ago, this suggests a highly unpredictable environment when looking at short-term windows. Another illustration would be the value of Bitcoin, which is normally one of the more stable assets, which decreased by half in the summer of 2021 before increasing once more to its prior levels.
Investment experts may be wary about assessing cryptocurrencies because of this rapid change.
Furthermore, a firm is not represented by cryptocurrency. As a result, Wall Street analysts are unable to undertake the usual study for which they are known to offer recommendations.
What are the rating averages for analysts?
Stocks frequently receive a score between 1 and 5 on websites that compile stock analyst ratings.
1 represents a buy, 2 represents an outperform, 3 represents a hold, 4 represents an underperform, and 5 represents a sell.


