We are live on !
Find out more
Latest Stock Portfolios of the World’s Best Investors & Hedge Funds

Mega AUM
Over $200B
Large AUM
$10B to $200B
Mid AUM
$2B to $10B
Small AUM
$250M to $2B
Micro AUM
Under $250M
Less than 10%
Less than 20%
Less than 40%
Less than 60%
Less than 80%
6+ months
1+ year
2+ years
3+ years
5+ years
10
50
100
250
500
1,000
2,500
5,000
10
50
100
250
500
1,000
2,500
5,000
| # | Name | AUM |
AUM Growth |
AUM Growth % |
Quarter Est. Return |
3 Year Est. Return | Holdings | Portfolio Turnover |
Avg Holding Period (Yrs) |
|
|---|---|---|---|---|---|---|---|---|---|---|
| 6976 |
6976
Brightline Capital Management
Miami,
Florida
| $92.2M | +$67.8M | +277% | 21.3% | 810% | 12 | 83.33% | 0.1 |
|
| 6977 |
6977
First Community Trust
Dubuque,
Iowa
| $92.2M | +$4.72M | +5% | 10.7% | 128% | 302 | 9.6% | 1.7 |
|
| 6978 |
6978
BCU Wealth Advisors
Vernon Hills,
Illinois
| $92.1M | – | – | 9.37% | 57.7% | 39 | – | 0 |
|
| 6979 |
6979
Rip Road Capital Partners
Boston,
Massachusetts
| $92M | -$7.9M | -8% | 14.6% | 121% | 16 | 50% | 1.6 |
|
| 6980 |
6980
Pitti Group Wealth Management
Victor,
New York
| $91.9M | +$4.5M | +5% | 9.59% | 65.3% | 66 | 10.61% | 1.6 |
|
| 6981 |
6981
Capital CS Group
Irvine,
California
| $91.9M | +$7.16M | +8% | 5.25% | 22.5% | 118 | 66.95% | 0.6 |
|
| 6982 |
6982
Orser Capital Management
Southlake,
Texas
| $91.7M | -$9.36M | -9% | 10.4% | 128% | 52 | 19.23% | 3.9 |
|
| 6983 |
6983
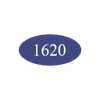
1620 Investment Advisors
Plymouth,
Massachusetts
| $91.5M | +$3.2M | +4% | 8.39% | 68.9% | 159 | 25.79% | 1.3 |
|
| 6984 |
6984
Brandywine Managers
Hockessin,
Delaware
| $91.3M | +$32.1M | +54% | 27.5% | 96.3% | 44 | 18.18% | 3.2 |
|
| 6985 |
6985
Cypress Capital Management (Wyoming)
Sheridan,
Wyoming
| $91.3M | +$6.15M | +7% | 10.1% | 161% | 190 | 15.26% | 4 |
|
| 6986 |
LP
6986
LB Partners
Charlottesville,
Virginia
| $91.2M | – | – | 0.61% | – | 27 | – | 0 |
|
| 6987 |
6987
Kraematon Investment Advisors
Braintree,
Massachusetts
| $90.9M | +$9.7M | +12% | 10.9% | 80.5% | 87 | 18.39% | 1.6 |
|
| 6988 |
6988
Waycross Investment Management
Bellingham,
Washington
| $90.9M | +$3.98M | +5% | 7.92% | 49.6% | 52 | 19.23% | 0.9 |
|
| 6989 |
6989
Snow Lake Management
Menlo Park,
California
| $90.7M | +$497K | +0.6% | 38.6% | – | 7 | 71.43% | 0.8 |
|
| 6990 |
GBA
6990
Garrison Bradford & Associates
New York
| $90.7M | +$5.93M | +7% | 10.3% | 63.5% | 32 | 6.25% | 6.8 |
|
| 6991 |
6991
Evolutionary Tree Capital Management
Alexandria,
Virginia
| $90.6M | +$13.1M | +17% | 18.4% | 139% | 37 | 27.03% | 1.4 |
|
| 6992 |
6992
Stephen J. Garry & Associates
Garden City,
New York
| $90.3M | – | – | 9.05% | – | 39 | – | 0 |
|
| 6993 |
6993
Elm Ridge Management
Briarcliff Manor,
New York
| $90.2M | +$7.42M | +9% | 5.2% | 93.6% | 25 | 0% | 3.9 |
|
| 6994 |
6994
Redwood Wealth Management Group
Medford,
New Jersey
| $90.2M | +$4.67M | +5% | 11.1% | 74.1% | 152 | 11.18% | 0.9 |
|
| 6995 |
6995
FNY Investment Advisers
New York
| $90.1M | -$78.1M | -46% | 17.6% | 386% | 880 | 66.36% | 0.8 |
|
| 6996 |
6996
Wulff, Hansen & Co
San Rafael,
California
| $90.1M | +$4.39M | +5% | 11.6% | 85.8% | 89 | 10.11% | 1.7 |
|
| 6997 |
6997
Gates Foundation
Seattle,
Washington
| $89.9M | +$6.01M | +7% | 15.6% | 58.1% | 9 | 11.11% | 2.6 |
|
| 6998 |
PL
6998
Portman Ltd
Grand Cayman,
Cayman Islands
| $89.8M | – | – | 30.9% | – | 9 | – | 0.6 |
|
| 6999 |
6999
Marvin & Palmer Associates
Wilmington,
Delaware
| $89.6M | -$64.6M | -42% | 15.6% | 392% | 39 | 53.85% | 0.6 |
|
| 7000 |
7000
Willner & Heller
Encino,
California
| $89.6M | – | – | 12.2% | – | 134 | – | 1.6 |
|